

My Projects
Some Of My Projects
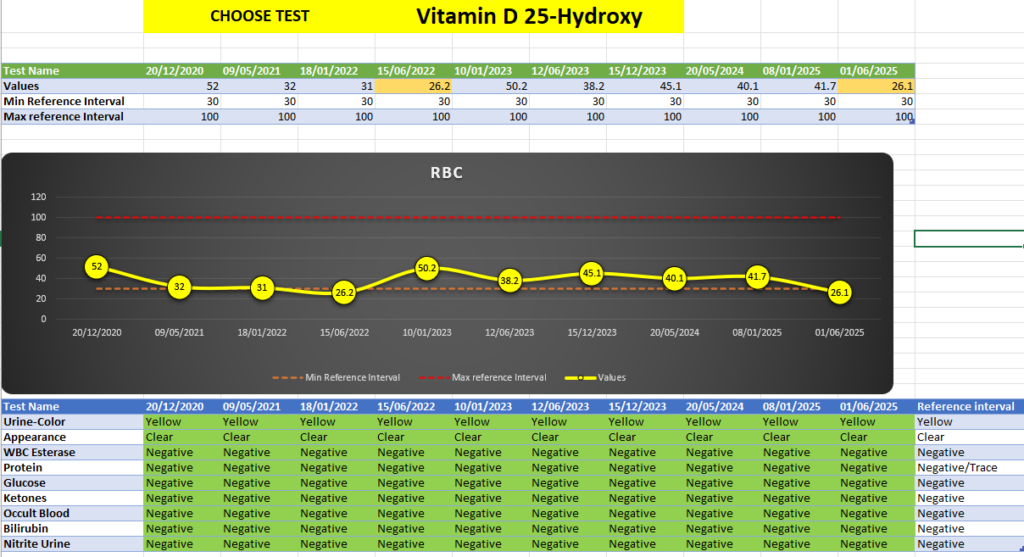
Patient Test Report
Create a patient test report that shows results by date in a clear table format. Each test should be listed in columns with values recorded over time. Add a line chart to show how the results change and whether they are within the normal range. Highlight any values outside the reference range with different colors for easy understanding.
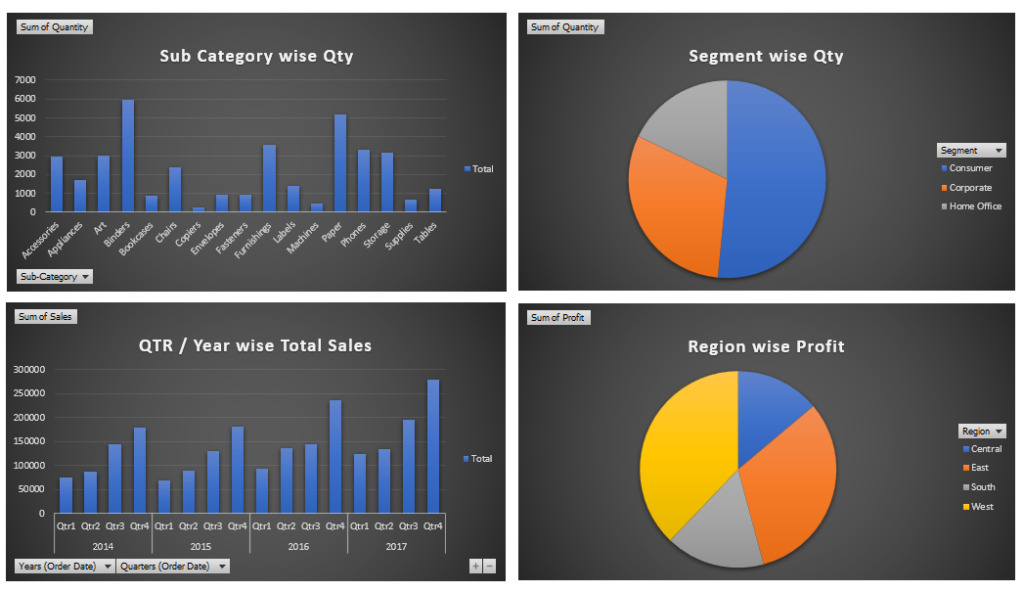
Sales Data Visualization
Create bar charts and pie charts to clearly visualize digital product sales data. Bar charts can be used to compare sales across different products or time periods. Pie charts help show the proportion of total sales contributed by each product. This makes it easier to understand trends and performance at a glance.
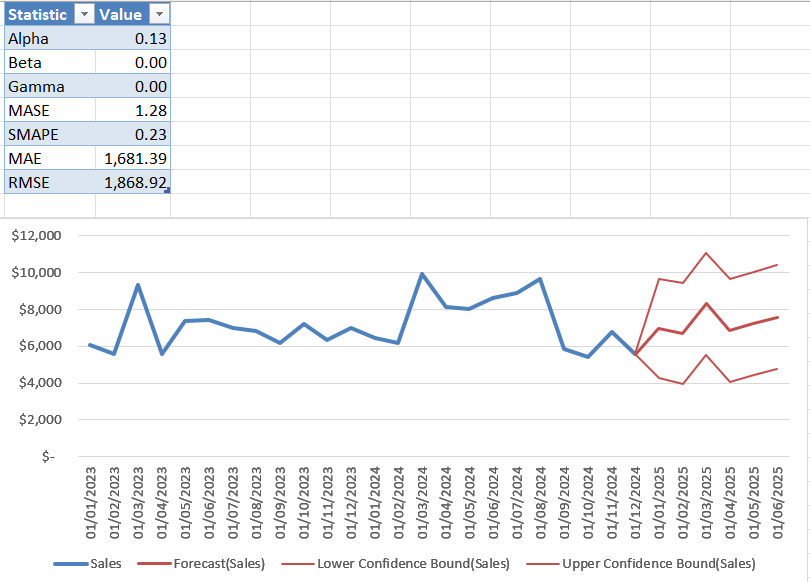
Future Sales Forecasting
Create a graph that analyzes past sales data and shows trends over time. Use this data to predict future sales based on previous performance. Include a clear forecast line along with minimum and maximum predicted sales ranges. This helps in understanding possible future outcomes and making better decisions.
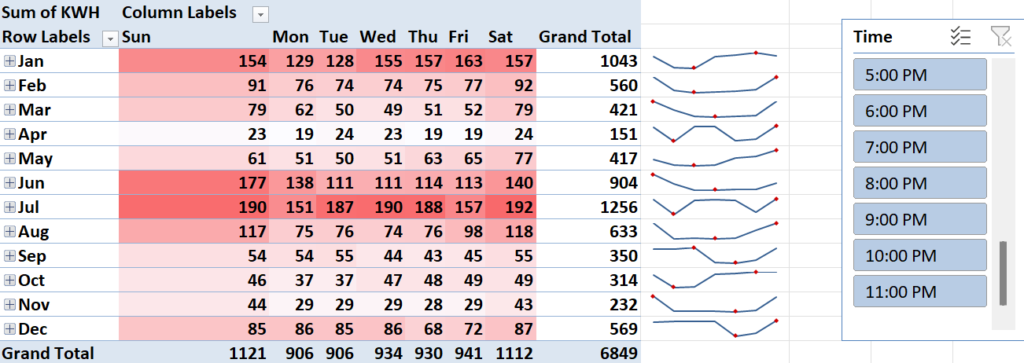
Electricity Consumption Report
Create a monthly electricity consumption report that shows daily usage in a clear table format. Use a heat map to easily identify high and low consumption days. Add weekly line bar charts to show overall consumption trends. Include a time filter (e.g., 5 PM or 11 AM) to analyze usage patterns at different times of the day.
Services
My Services
SQL
I use SQL to manage, clean, and analyze large datasets efficiently. I write optimized queries to extract meaningful insights and support data-driven decisions. My expertise includes data transformation, reporting, and database management.

Power BI
I create interactive dashboards and reports in Power BI to visualize data clearly. I turn complex data into easy-to-understand insights using charts, KPIs, and filters. This helps businesses track performance and make informed decisions.
Excel
I use Excel for data analysis, reporting, and automation. I work with formulas, pivot tables, and charts to organize and interpret data effectively. I also build dynamic reports that simplify daily business tasks.


Welcome to my profile
Professional Data Analyst
I am a skilled Data Analyst with expertise in SQL, Power BI, and Excel. I specialize in transforming raw data into meaningful insights that support smart business decisions. My focus is on delivering clear, accurate, and impactful data solutions.
30+
Total Projects
20+
Total Testimonials
1k+
User’s Request
Tools

SQL Server
Microsoft Power BI

Microsoft Excel

Power Query & Power Pivot

DAX (Data Analysis Expressions)